Exploring complexity and self-organization with a simulation tool
We live in a complex world that is difficult to predict. This makes it hard to understand and navigate our social and natural environment. Andre Costopoulos from the University of Alberta spent his time as Visiting Research Fellow at AIAS creating a computer simulation tool to help us understand and teach some of the central lessons of complexity theory that can help us collectively be better in our world.

REPORT FROM AIAS VISTING FELLOW ANDRE COSTOPOULOS, UNIVERSITY OF ALBERTA, CANADA
One of the hallmarks of complex systems is that very simple interactions between a few elements can generate complex patterns. In other words, complex patterns may emerge from simple systems as they undergo transformations, feedback loops or self-organize. Many processes in nature and society show self-organization. For example, the complex and organized behaviour of financial and stock markets, or the flocking of birds, emerge from a simple interactions between agents like traders or birds.
Self-organized systems, like stocks and finance, are also subject to the patterns of long periods of stability broken by occasional, but large and sudden catastrophes, such as stock crashes. We witness the behavior of such complex systems in our daily lives, from earthquakes to the severity of work accidents. These are systems in which most events have a very small and limited impact, but in which a very few, infrequent events can cause a system-wide reorganization.
In a true self-organized critical system, the distribution of event sizes follows a well-defined distribution known as power-law, and some parameter combinations in this simulation produce power-law distributions. But it can also produce a wide range of regimes under which small events are frequent and large events are rare, without necessarily conforming to a power-law distribution.
The classic example of complex self-organized system is the sand pile. At each time step, one grain of sand drops on a sand pile. Most of the grains that hit the pile will have a very limited, localized impact. They will displace a few other grains. Sometimes though, when the pile is organized in a certain way (critically self-organized), if one of its sides has become very steep, for example, one new grain hitting the pile can cause a large avalanche. In other words, it can cause a reorganization of the pile into a less critical state.
From the outside, it may look like it must have been an extraordinary event that caused the catastrophic avalanche. What has changed here, however, is not that a new type of event has been added to the system. There is only one kind of event in this system: A grain of sand being dropped on the pile. What has changed is the context in which the event takes place. Most of the time, the event will hardly be noticeable. This time, however, it causes a catastrophe.
Some of the world around us behaves exactly that way. When we see an unusual or extraordinary event in our world, like a market crash, or in archaeology, like the sudden abandonment of a region, or the rapid replacement of a type of pottery decoration, we tend to look for extraordinary or unusual events to explain the change. We look for a mega-drought, or a military conquest, for example. Instead of looking at the internal dynamics of the system, instead of looking for the causes of a big change in its routine functioning, we tend to look for an unusual external shock that drove it.
Complexity theory teaches us that we don’t necessarily need an unusual cause to explain an unusual event. We just need a normal, everyday, standard event to happen in a critical context, like the steep side of a pile.
From this we learn that because we live in a complex system, and however frustrating it that might be, not everything that happens to us has an explanation or a direct cause. Some of what happens to us as individuals, groups, and as a species, is just the result of the dynamics of the system in which we are embedded. The magnitude of events that affect us may not match the magnitude of their causes.
In some circumstances and at some scales, we drive the system. In others, it drives us. This recognition has broad implications for planning, for adaptation, and for how we conduct ourselves individually and as organizations in the world. Good policy starts with humility about our place in the world as individuals, organizations, groups, and as a species.
Another unfortunate consequence of living a critically self-organized world, is that we learn that most of our actions have limited and localized consequences. Those of us who less risk averse learn that brinksmanship pays, because no matter how far they push, there are normally no catastrophic consequences. Until there are. Combining this with centralization of power, it isn’t surprising that we sometimes suffer very large catastrophes indeed.
To exemplify these and other insights of complexity theory, I created a little digital sand pile model with which we can experiment to generate complex, self-organized behaviour. I added a few features to the classic sand pile model, such as observer agents that move around in the sand-pile world, perceive the sand pile(s) and can even modify them if you want. Sometimes you’ll see the observer agents flashing, that means they’re unhappy with all the avalanches happening around them and are about to move elsewhere.
I also gave the user the ability to let the grains of sand jump around and try to get on top of the piles they see in their neighbourhoods. This very limited set of interactions allows the model to display some very interesting patterns of self-organization. The next step is to write a teaching guide to go with it, with experiments that you can do and the lessons that go with them.
You can download the tool here. If you have Netlogo installed on your computer, you can just start it up. Or you can go to NetLogoWeb and upload the file there to use it.
Here are two little quick experiments to get a sense of how you can use the tool to teach and learn.
Experiment one: The simple sand pile
At the bottom of the window, click the “simple pile” button. In the top left of the window, hit the big “go” button. You should see some green sand starting to form a small pile up on the table (the large black area in the middle). All the sand is dropping on one spot and tumbling down to the table’s surface from there.
Each time a grain of sand hits the pile, it has an impact and causes an avalanche. Some avalanches are small and very localized, and some affect a larger part of the pile. The two histograms below the table show distributions of avalanche sizes as the sand grains drop on the pile. The bottom one shows the distribution of actual avalanche sizes, and the top one shows the distribution of avalanche sizes observed by the agents.
With these settings, the agents try to get away from places where they see a lot of avalanches. They like to be in quiet places. Note that the actual distribution of avalanche sizes looks more like a normal distribution, but the distribution of observed avalanche sizes has many more small avalanches than large ones. The agents see a high proportion of small avalanches. They only see large avalanches on occasion. Large avalanches happen more frequently than the agents realize.
Because of their behaviour, the agents think their world works quite differently form the way it actually does. For many students, that can be lesson number one of the simulation. The agents think they live in a world in which there are many small avalanches and few larger ones, but that’s only because of the way they behave, not because of the underlying distribution of actual avalanche sizes. For many students, this can be a pretty powerful lessons with deep implications. Seeing it exemplified so clearly can really hit home.
Now click on the “go” button again to stop the simulation. Click on “simple pile” again to reset the system, and make one tiny change to the parameters. Under the “Drop sand on the table” set of controls to the right of the table, set the rConstrain slider to 95.
Now instead of always dropping on the same spot, the green sand will drop on a small area equivalent to about five percent of the table’s surface. Click “go” to launch the simulation. It will take a little while longer before you start to see avalanches, because the sand load is more distributed.
When the avalanches begin, the actual distribution of avalanche sizes will look very different than in the previous run. What do you think is happening? Why?
Experiment two: The simple sand layer
When you’re ready, click on the “Go” button to stop the simulation if it is running. Now click on the “Drop, Jump, Level” button at the bottom of the window. This sets up a scenario in which grains of sand drop onto the table randomly, the observer agents try to take sand off big piles and place it lower (they try to level their neighourhood), and in which grains of sand look for higher piles on which they can jump.
We’re also going to lay down a thin layer green sand on the table to give the system something to work with. Click on the “Green” button under the “Add layers of sand” section of the controls, to the right of the table.
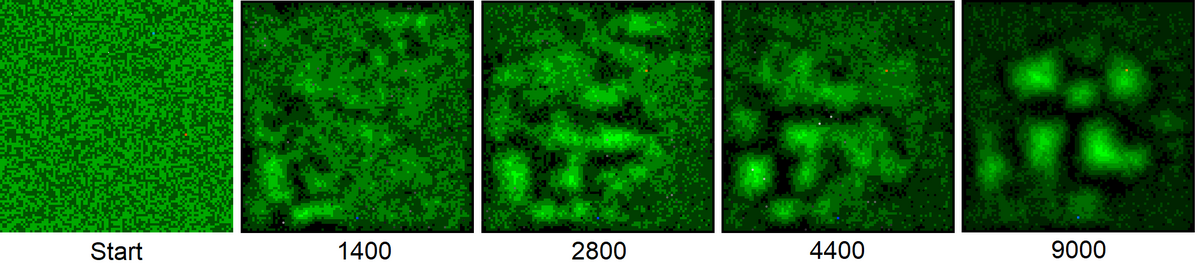
You should be looking at a fairly noisy, random-looking layer of sand. The brighter patches have more sand on them, and the dimmer patches have less.
Click on “Go” to start the simulation. Now sand is dropping on the table, observer agents are trying to level the piles in their neighbourhoods, and sand is actively trying to jump on the largest piles it can see nearby.
These three simple processes together will transform the table from a random layer of sand into an organized series of hills and valleys. It might take a while, depending on how fast your computer runs (and it could be slow on NetLogoWeb), but it will get there.
This is self-organization. No one in the system is trying to organize it. No one is even aware that there is a system. Each of the elements has one very simple set of instructions to follow. And the result is organization, and they have very limited and localized knowledge about their environment. No one in this system is trying to create the patterns you will observe forming on the table, and yet, they will. This can be another powerful lesson for students.
Because of the dynamics of the system, we can predict that larger piles will develop over time and may even eventually coalesce into one large pile, but we can’t predict where or when. When a big pile starts to develop somewhere on the table, we might be tempted to think that something special or different is happening there.
What makes that spot different from the rest of the table? Is the sand over there better at jumping up? Are the observer agents worse at leveling their neighbourhood? Is the table itself somehow different? Do the agents in that spot know something the others don’t?
The reality is that there is nothing special or different happening there. The same processes are happening in that spot as everywhere else on the table. Nothing special or unusual is responsible for the development of a big pile there, and nothing special or unusual is responsible for the development of a wide valley elsewhere on the table.
The timing and location of the piles will almost never be the same twice, because the system is extremely sensitive to initial conditions, and because it has stochastic processes. In other words, where and when a pile develops is historically contingent. It is no one’s fault, and no one plans it that way. It just happens because of the dynamics of the system and its historical trajectory (contingency).
If you were one of the agents in this system, and one of those big piles formed under you, it is possible that you could have caused it, but you certainly wouldn’t have planned it. It is also possible that the actions of another agent somewhere else on the table, maybe at the other end, actually caused it. But again, they didn’t plan it.
Think about this in the context of the development of wealth inequality in social systems, for example. Can you think of other real-world phenomena that behave like this?
Notice also that as the system self-organizes, the distribution of avalanche sizes perceived by the observer agents gets closer to looking like a Pareto distribution. That’s slightly different from the actual underlying distribution of avalanche sizes. Why is that? What does it mean?
Experiment with other parameters. Observe how the behaviour of the system changes. You can use it to think about a wide range of questions, like the role of intentionality in complex systems, just to name one. Have fun. If you have questions email me.
Contact
Andre Costopoulos
Email: Andre Ccostopou@ualberta.ca